15 posts tagged with "Mobility Science"

Human mobility research and applications

View All Tags

First Snow: What Happened to Oslo's Morning Buses

· 5 min read
David Crompton
Co-Founder, Chief Operating Officer, and Data Scientist

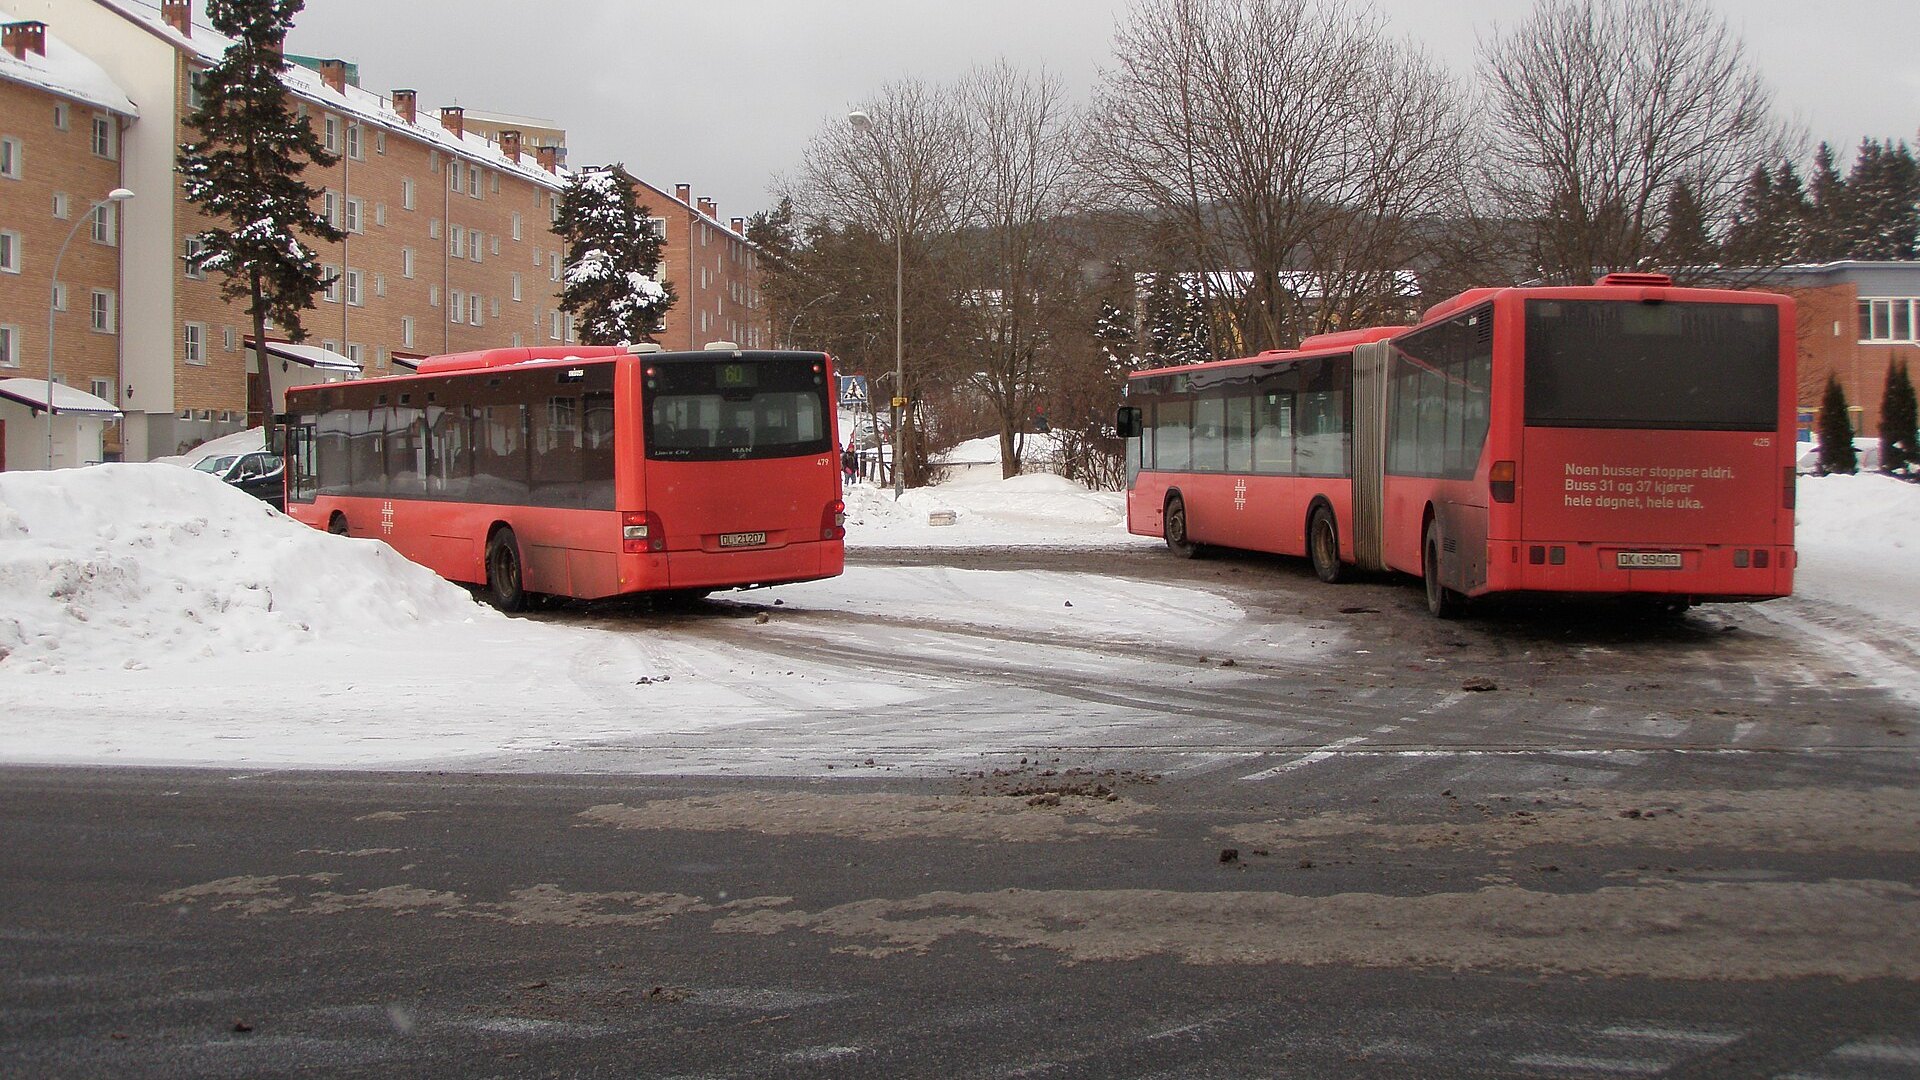
Two red Oslo buses at a snowy bus stop A file photo, not from 12 November: Tonsenhagen bus stop, February 2011. Photo: Aslak55, CC BY 3.0, via Wikimedia Commons; cropped.

Thursday 12 November brought the winter's first proper snowfall to Oslo. We compared the morning rush on Ruter's buses with the day before and with seven normal Tuesdays to Thursdays this autumn, using Entur's real-time records.

Between 07:00 and 09:00, 30% of scheduled bus departures left on time. The day before it was 61%, and on a normal day 62%.
Oslo's Buses Are Busier, and Slower

· 15 min read
David Crompton
Co-Founder, Chief Operating Officer, and Data Scientist

On 23 September the Guardian published a visual investigation of London's buses. It found them slowing down and losing passengers. We asked the same question of Oslo, using ten years of Ruter's timetables, and then followed the trip door to door across the whole network.

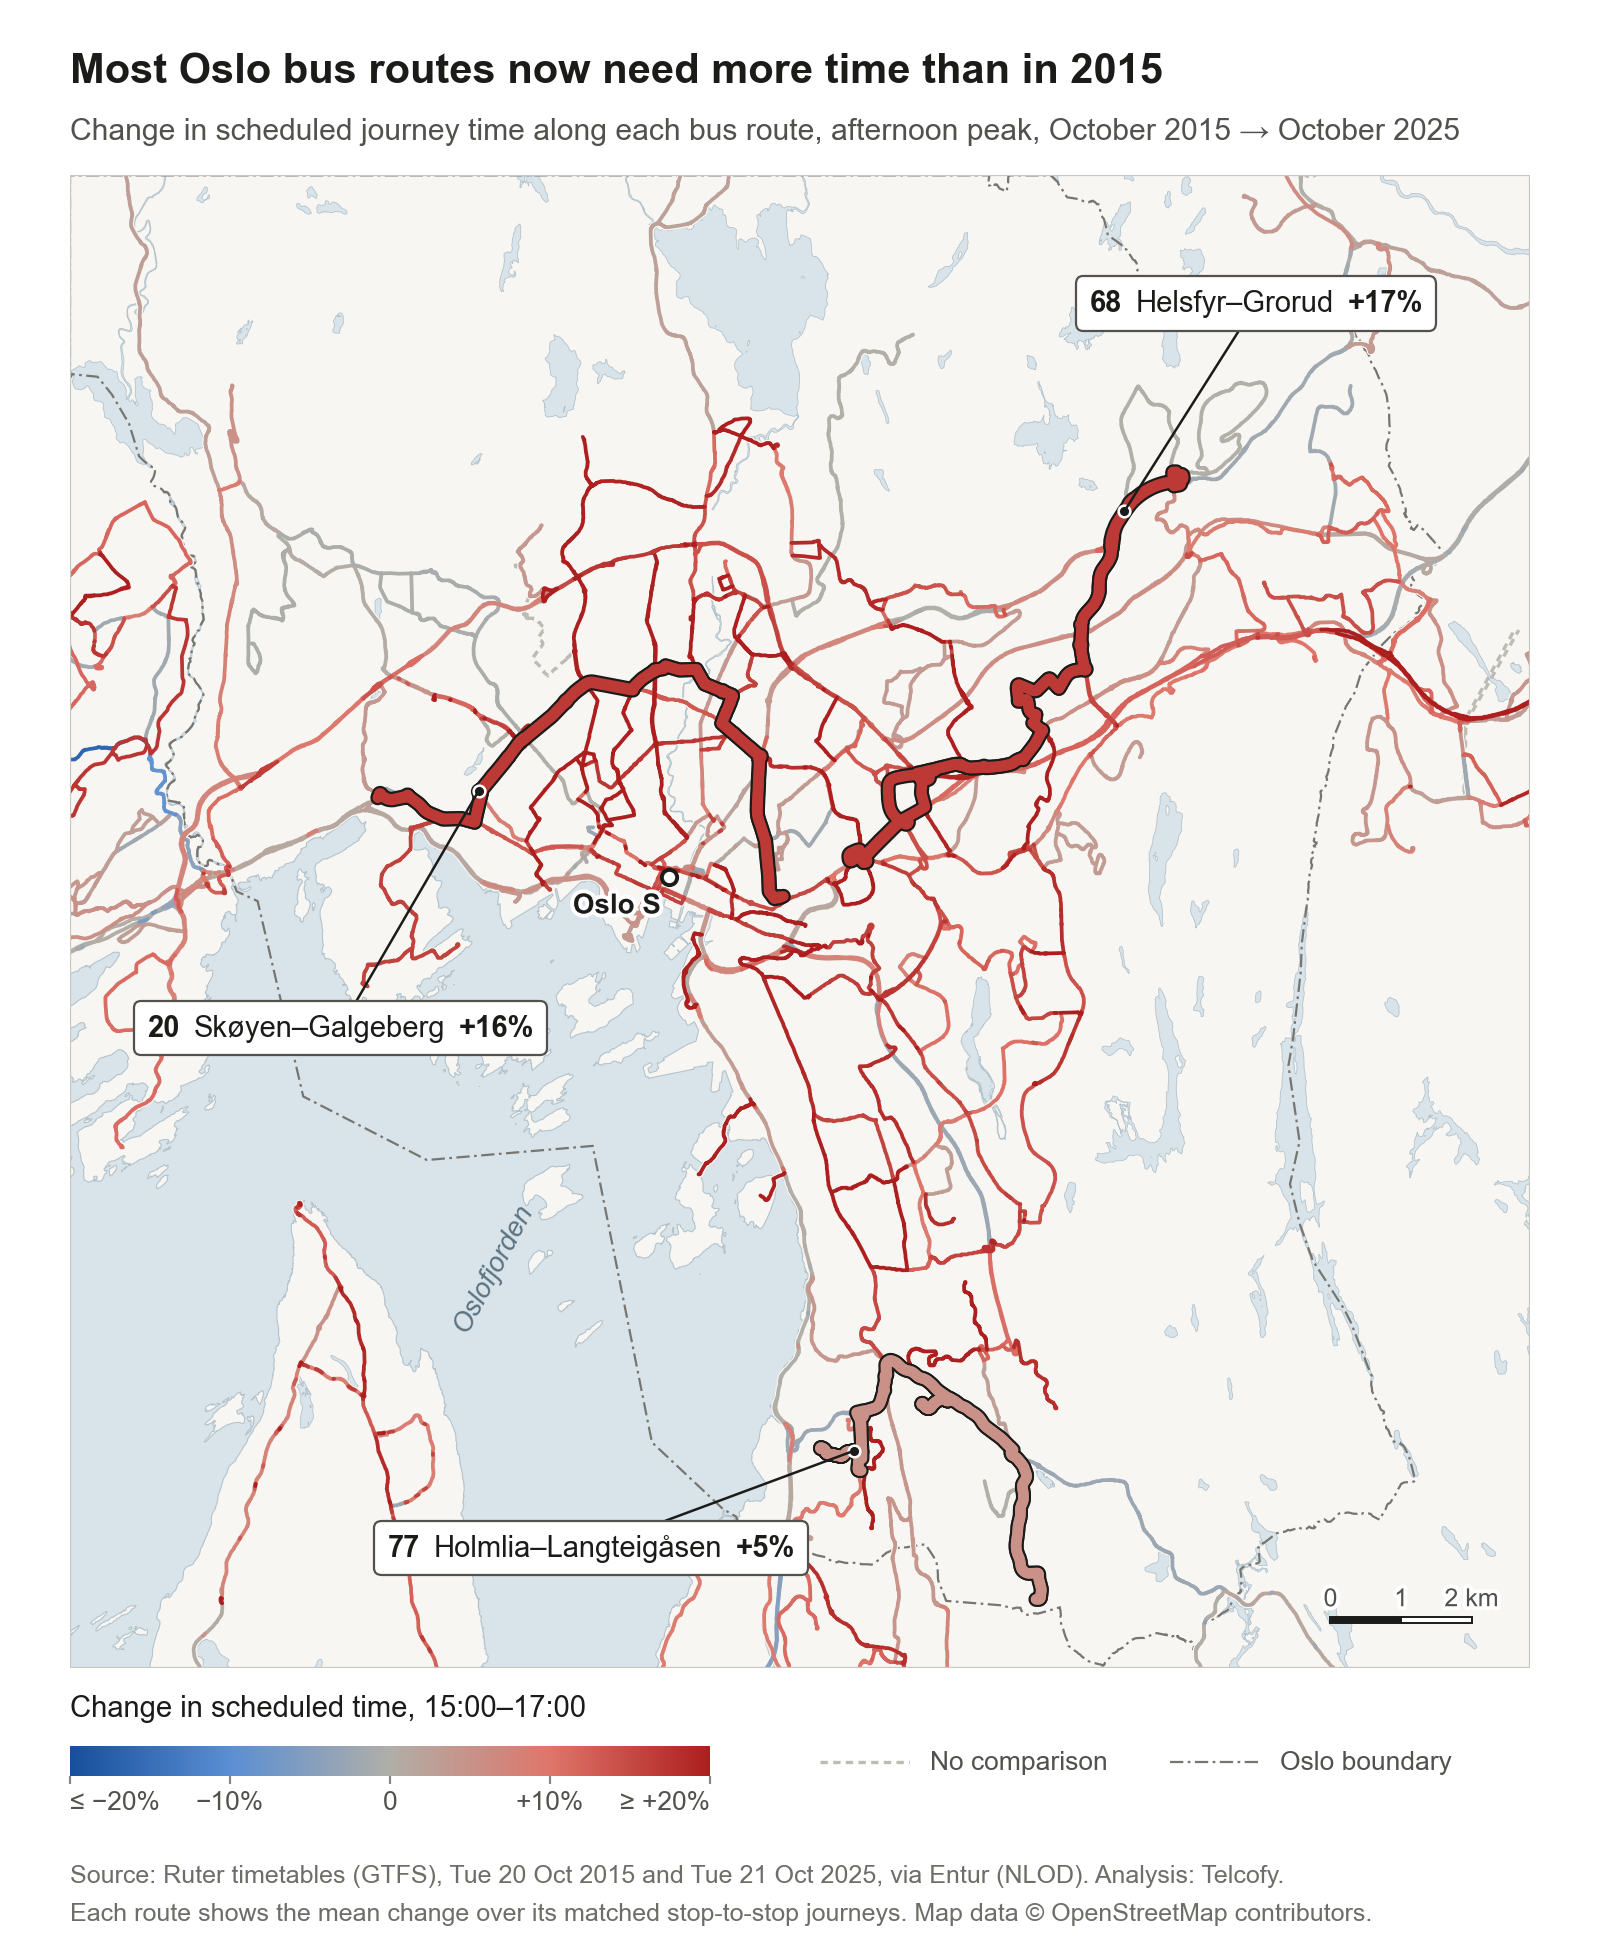
The short answer: Oslo's timetables now give buses about 7 to 8% more time between the same stops than in 2015. Unlike London's, Oslo's buses are not losing passengers. Ruter's city buses carried 31% more boardings in 2025 than in 2015. And door to door, trams and the metro soften the loss.

In this post, "slower" means the timetable allows more time for the same trip. We did not measure buses on the street. Ruter's own measurements come near the end.

Map of Oslo's bus routes coloured by the change in scheduled journey time between 2015 and 2025 Each 2025 bus route, coloured by how much more (red) or less (blue) time the afternoon timetable allows between the same stops than in October 2015. Colours pool every bus between matched stops, so more routes are coloured here than the 39 we count below.

Watching a City Breathe on Constitution Day

· 3 min read
David Crompton
Co-Founder, Chief Operating Officer, and Data Scientist

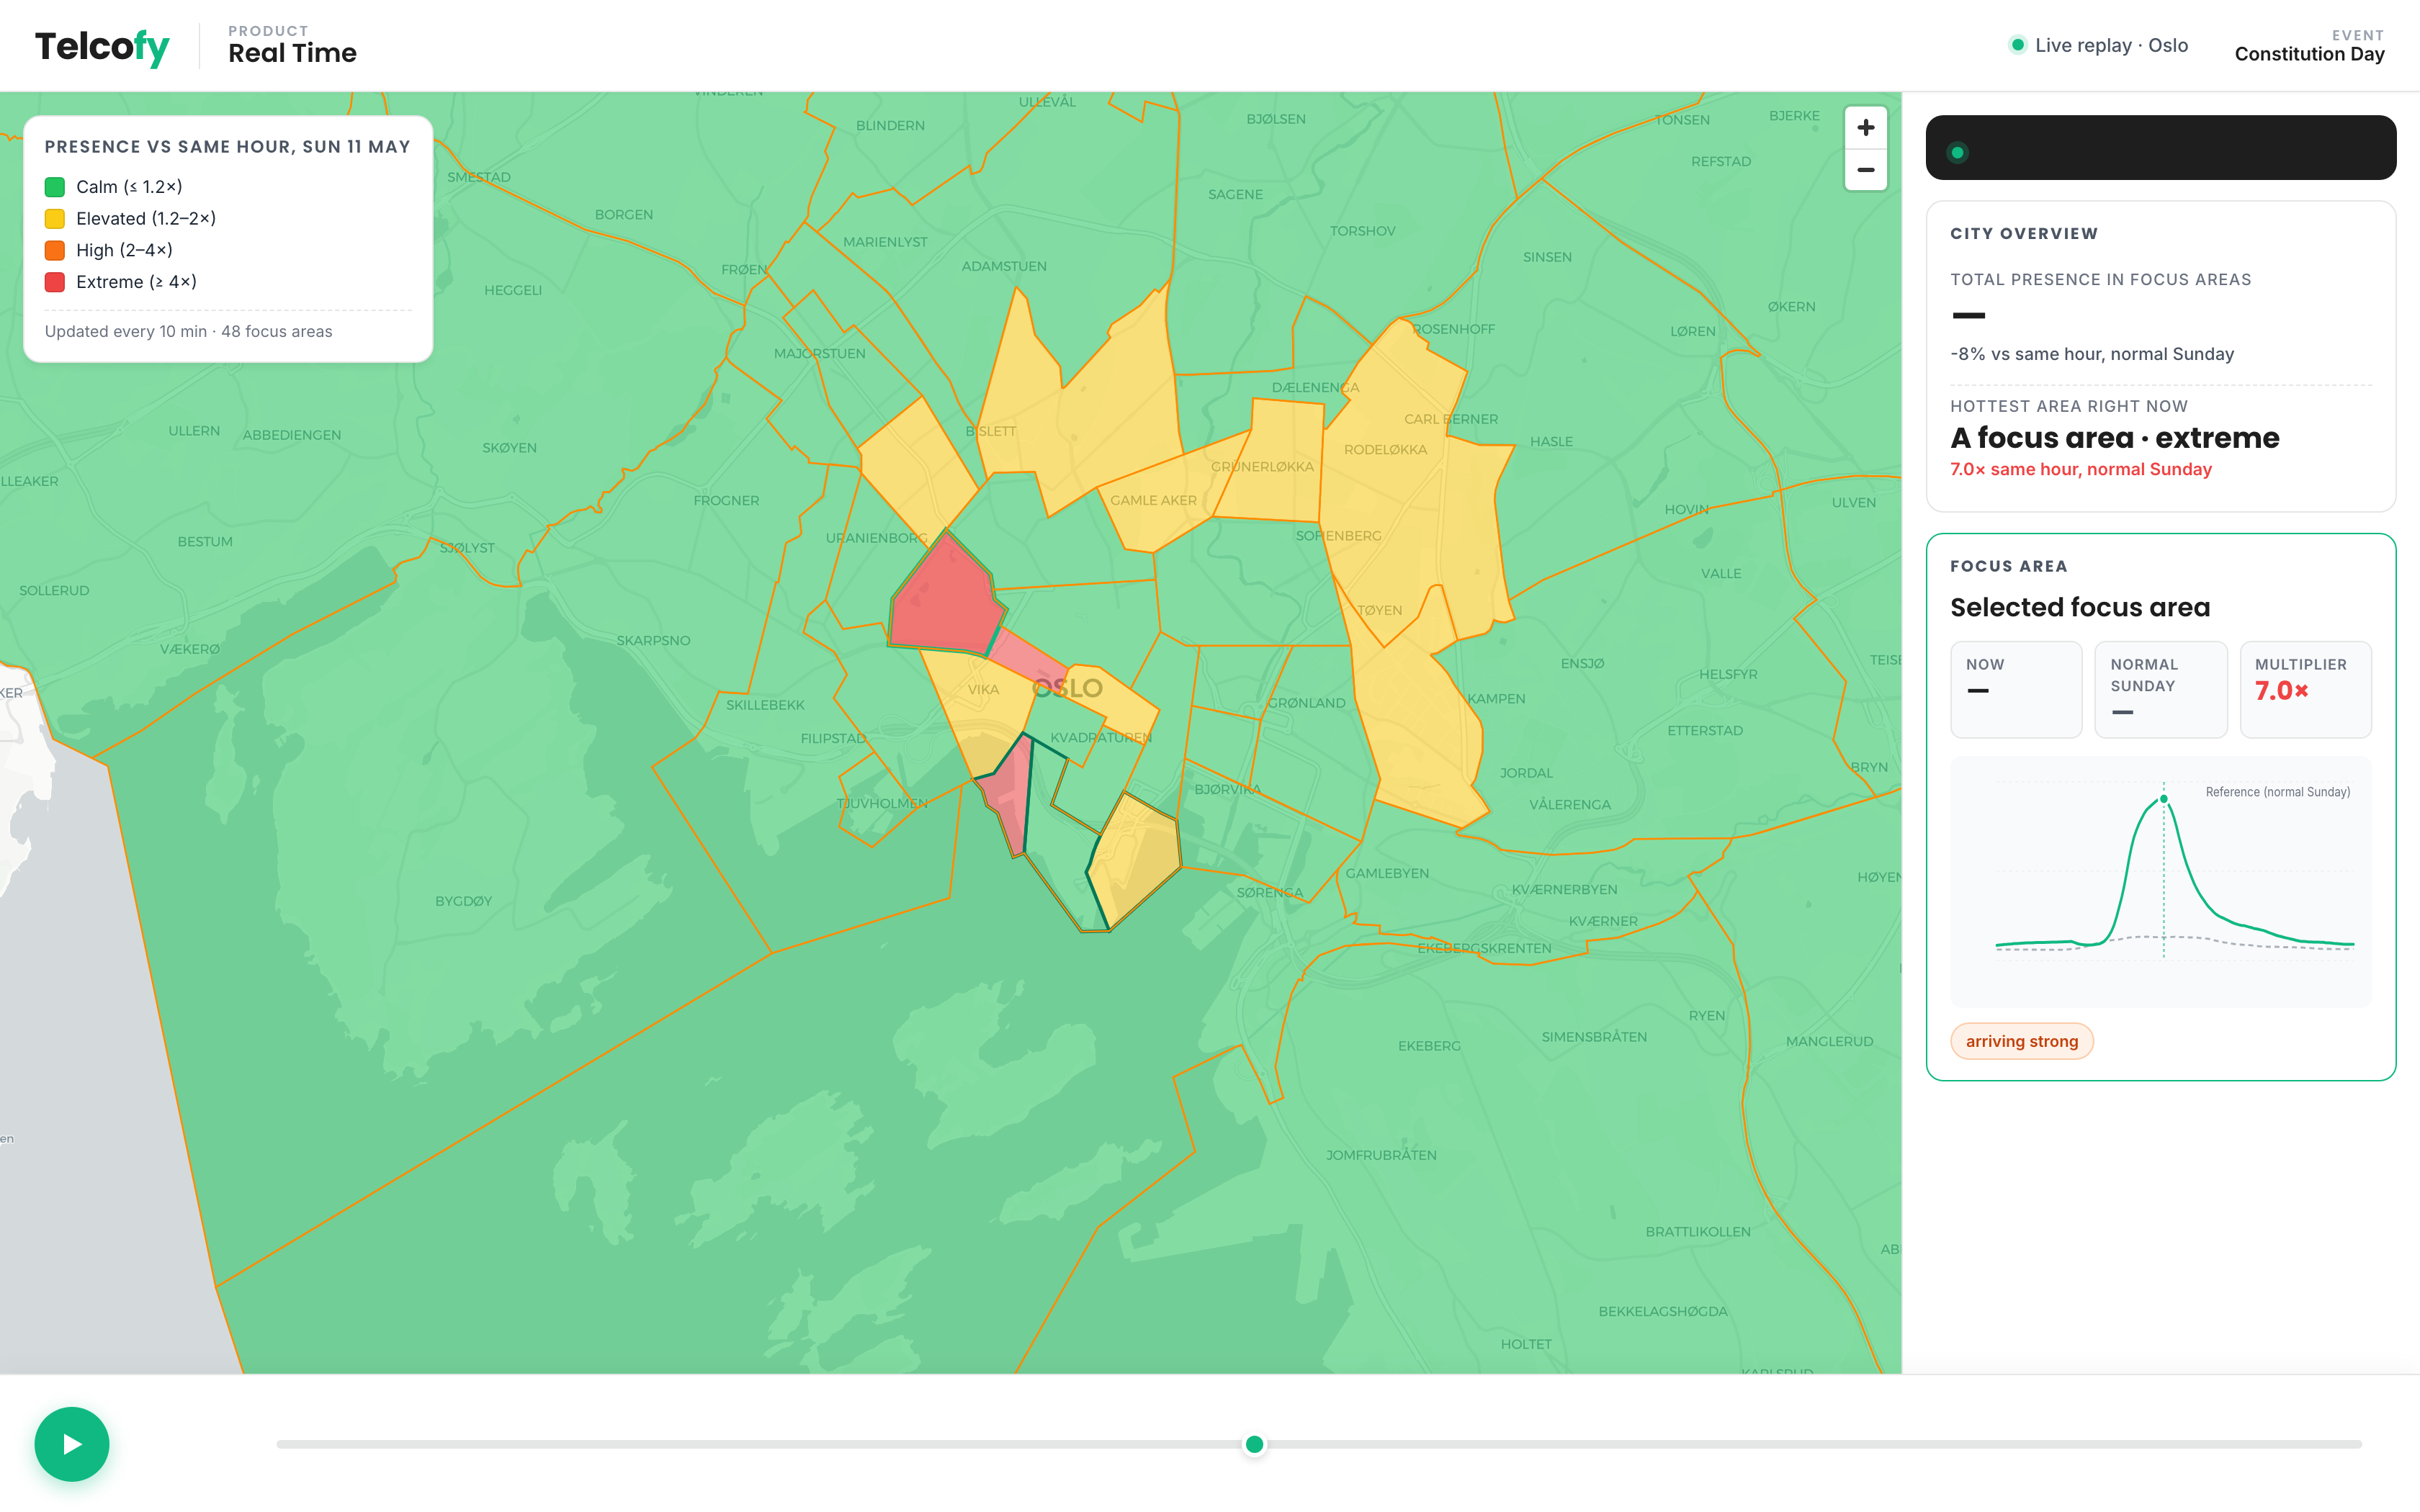
Every May 17, a wave of people moves through Oslo. Families gather along the parade route in the morning, the children's parade walks through the city centre through lunchtime, and the crowd drifts down to the waterfront for the rest of the afternoon. Everyone in Oslo knows this rhythm. We wanted to see if we could watch it happen, live, from the data.

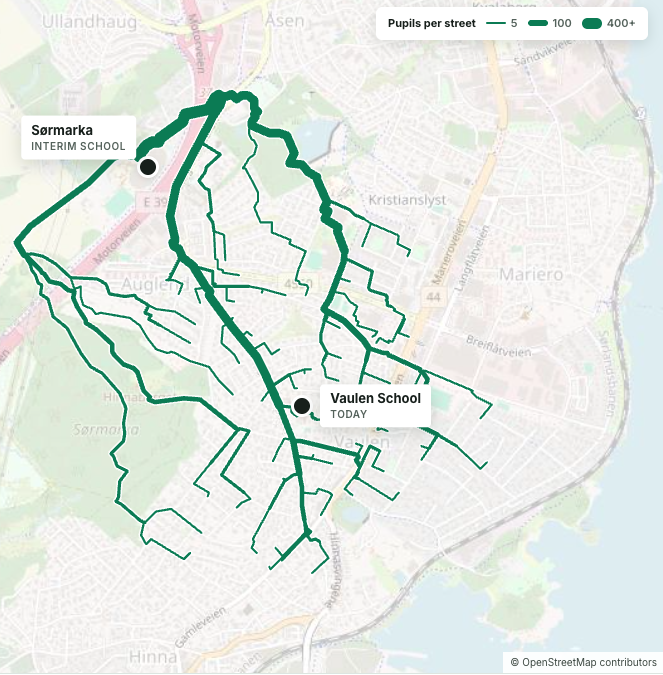
Anonymised dashboard view: parade peak, with focus areas along the route lit up Parade peak. The focus areas along the route light up; the surrounding city stays close to its normal Sunday. The busiest area in this moment runs around seven times its usual presence at the same hour.
The Roads Nobody Counts

· 6 min read

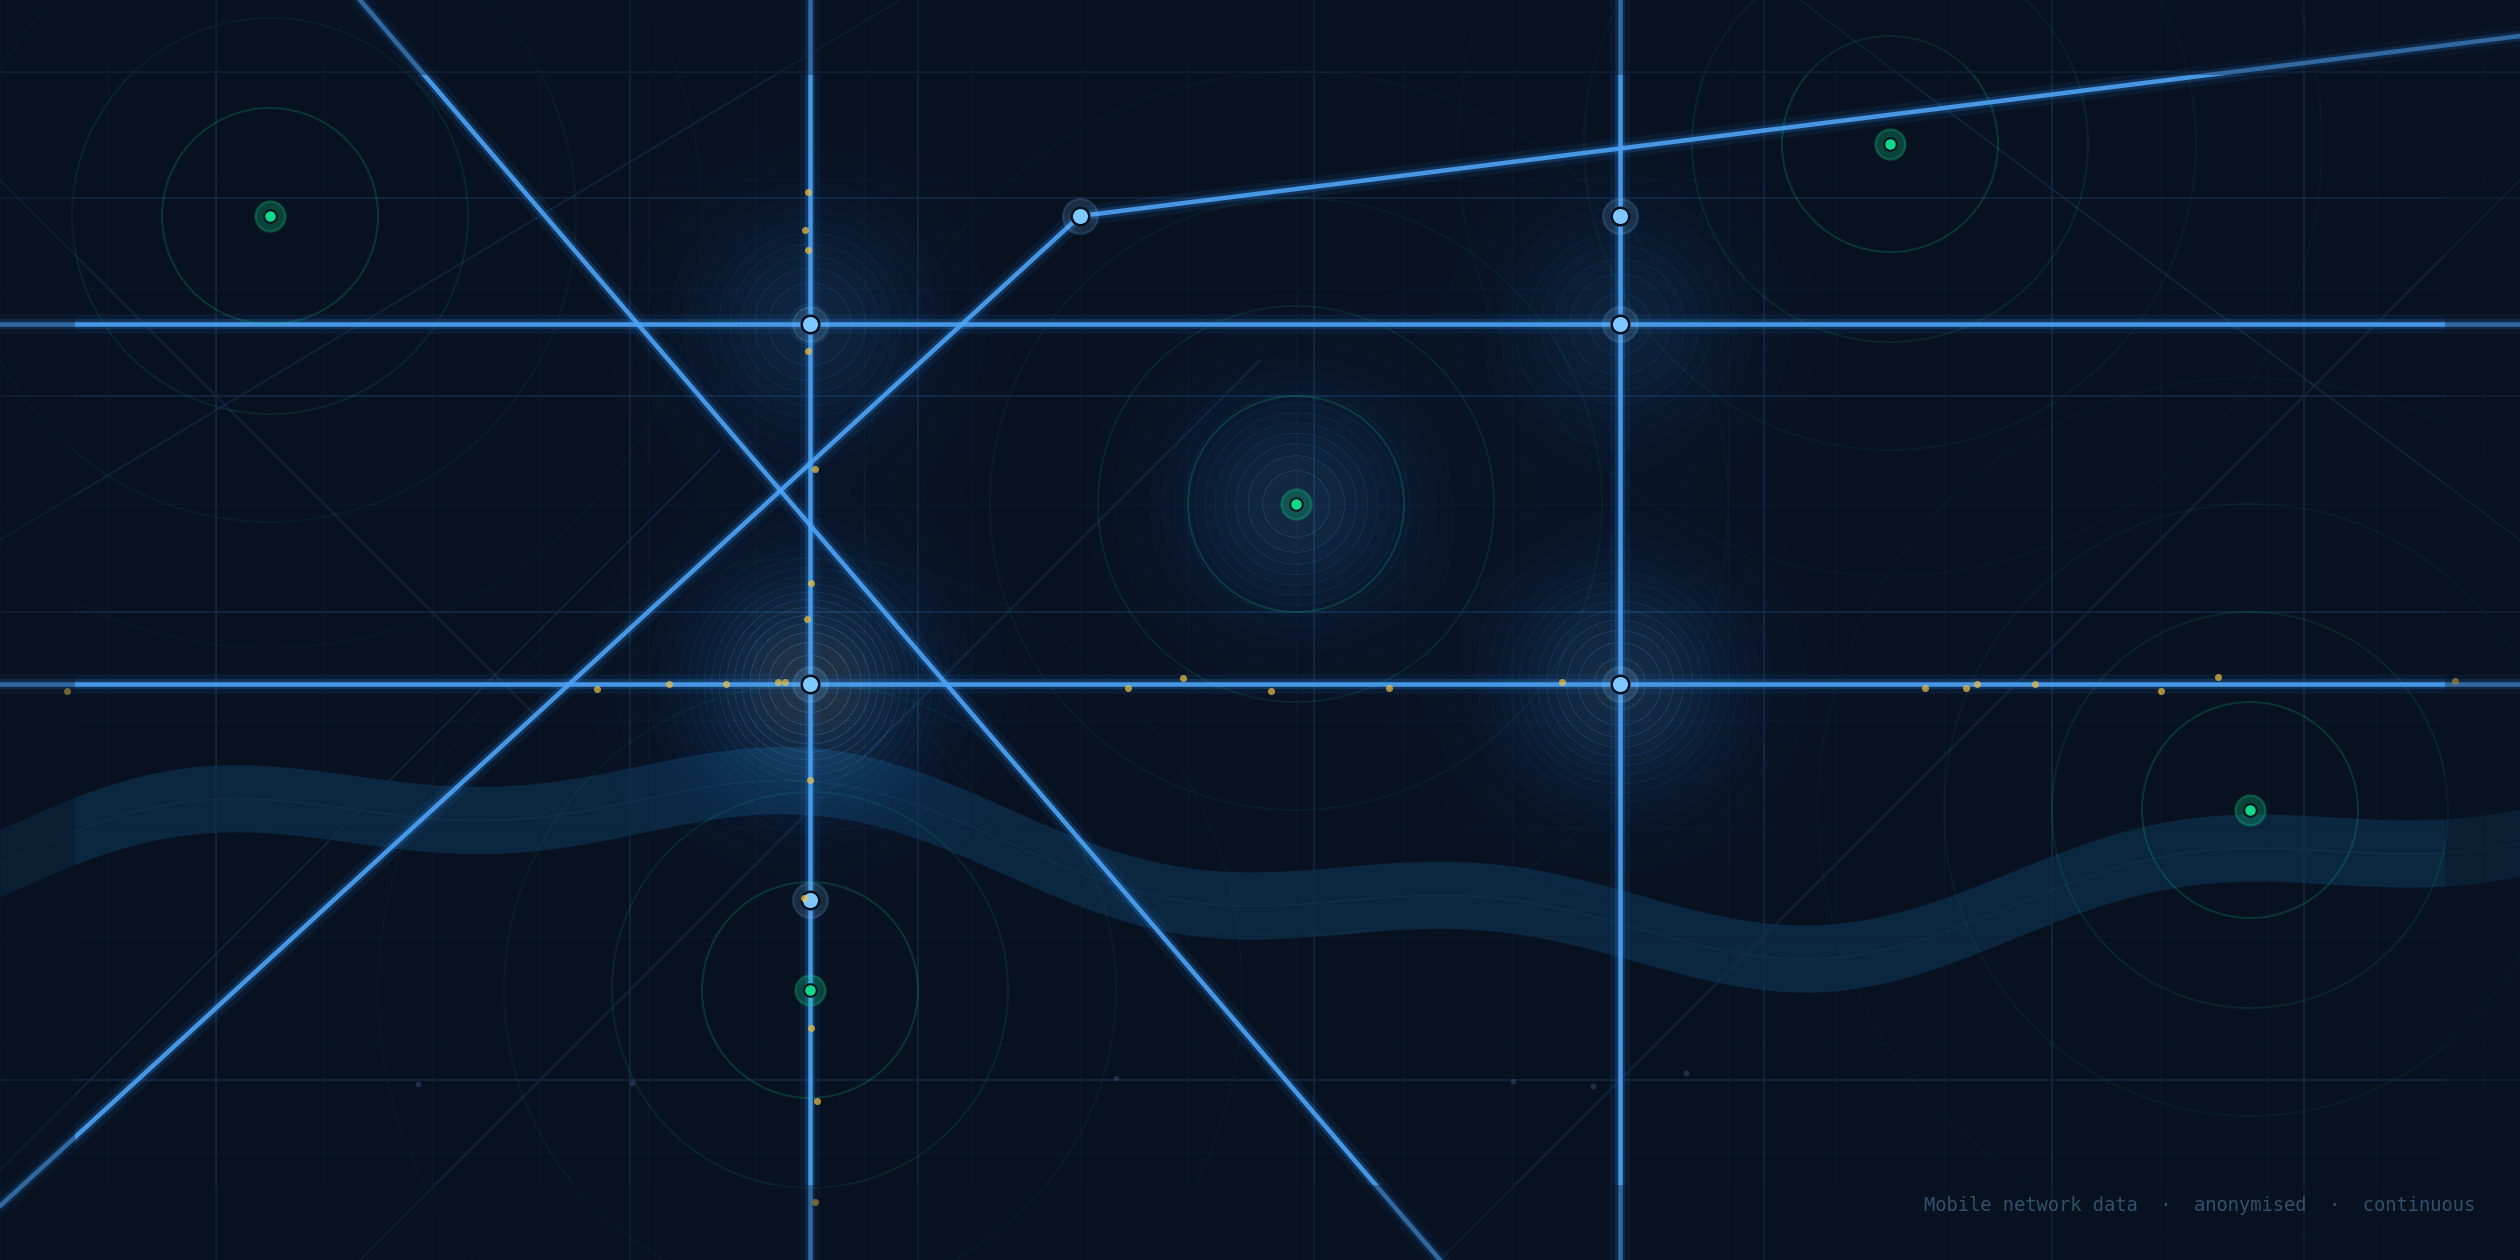
Road network at night with mobile data overlay

Most roads are never measured. Not because it is technically impossible, but because the traditional way of counting traffic — pneumatic tubes, sensor loops, fieldwork teams — simply cannot reach everywhere at a price anyone is willing to pay.

Across the Nordic countries and the Baltics, we have spent the last several years working with national transport authorities on a different approach: using anonymized mobile network data to measure traffic continuously, automatically, and at scale. Here is what we learned.

Unlocking Visitor Insights: The Mendo and Telcofy Pilot Project

· 3 min read

intro

Norway is a destination that draws visitors from around the world. Understanding who visits Norway, when they arrive, and how their visit develops over time is critical for better planning, resource allocation, and market analysis. Mendo analytics, in partnership with Telcofy, is leading a pilot project to gain a clearer, more continuous picture of tourist and visitor data.

When Signals Lie: Radio Physics and Mobility Insight

· 4 min read
David Crompton
Co-Founder, Chief Operating Officer, and Data Scientist

Mobility analytics often start with a simple idea: stronger signal means closer user. The real world is not that simple.

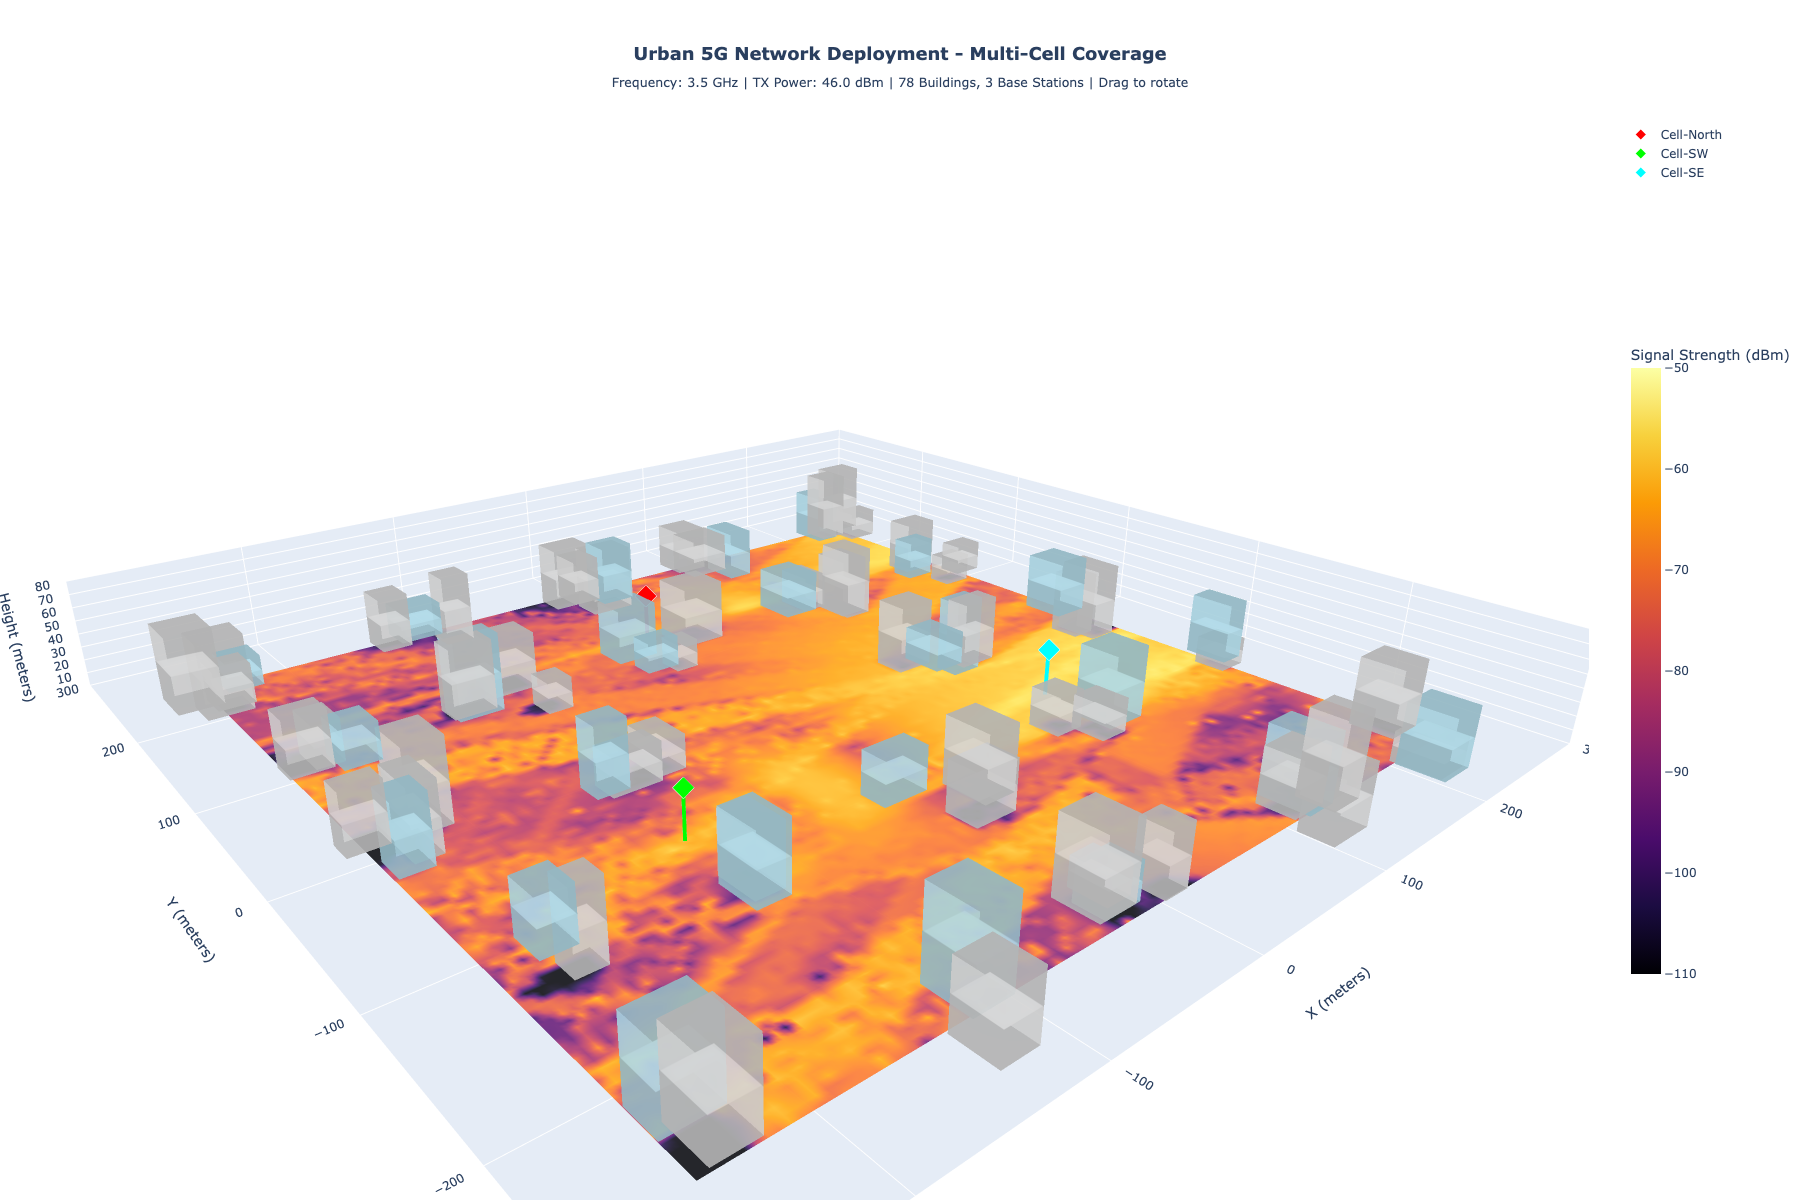
Radio waves bend, scatter, reflect, and get absorbed by the materials they encounter. Those physical effects can shift a device's apparent location by tens or hundreds of meters, even when the data pipeline is mathematically correct.

This post is the first in a short series on radio propagation and positioning accuracy. The goal is not to explain every equation, but to show why physics matters and how we validate positioning logic when ground truth is scarce.

3D town propagation